As the wine industry continues to evolve, understanding consumer preferences becomes paramount for winemakers and distributors. Recently, Quini released data that shed light on an interesting trend: consumers overall have a preference for sweeter Rose wines. This finding challenges the notion that mostly those new to the wine journey prefer sweeter products. It also highlights the importance of catering to diverse palates. In this article, we will delve into the data, exploring consumer preferences for sweetness in Rose wines across different age groups and levels of wine experience. Let’s uncover some fascinating insight and their implications for the wine industry.
CONCLUSION
The data from Quini’s analysis has unveiled strong evidence for consumer preference for sweeter Rose wines. Across various age groups and levels of wine experience, the wines that captured sweeter impressions in consumer Quini wine tastings, consistently got higher ratings from participants. Conversely, Rose wines that garnered a lower impression of sweetness, made up the majority of the products that were rated lower.
These findings emphasize the importance of catering to diverse palates and challenging traditional expectations within the wine industry. For winemakers, distributors and retailers, understanding and embracing this consumer preference can open new avenues for product development, marketing and sales strategies. Offering a range of Rose wines with varying sweetness levels can attract a broader customer base and enhance consumer satisfaction. By embracing this trend, wine professionals can also tap into evolving consumer preferences and foster a deeper connection with their target audience.
In a world where personal taste and preferences reign supreme, adapting to consumer demands becomes crucial for businesses to thrive. The sweeter side of Rose wines presents an exciting opportunity for winemakers to innovate, experiment, and deliver exceptional products that resonate with a wider range of wine enthusiasts. By embracing this data-backed insight, we can reshape the wine landscape and create a more encompassing and captivating experience for all.
FINDINGS
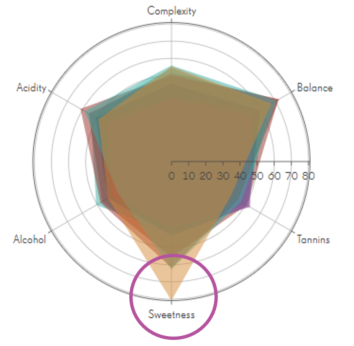
Overall
Amongst all consumers combined, the average sweetness impression score range for the top 5 rated Rose wines on Quini was 55.60/100 to 80.85/100. The average sweetness impression range for the bottom 3 rated Rose wines on Quini was 38.49/100 to 43.16/100.
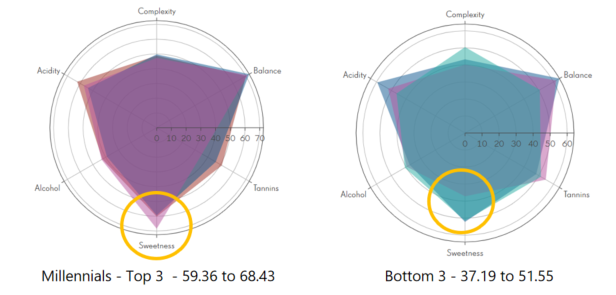
Exploring Age Groups: Millennials vs. Boomers/Gen X
The top 3 millennial consumer rated wines generated a Sweetness impression range from 59.36 to 68.43. The bottom 3 wines however got an impression score range of 37.19 to 51.55.
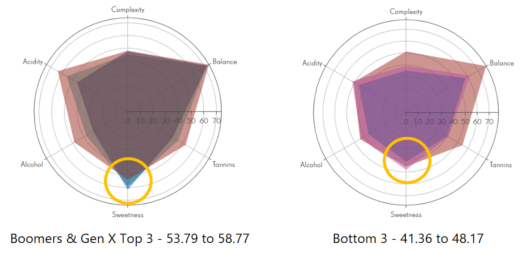
Further emphasizing the findings, Boomers and Gen Xers, typically associated with having somewhat more experience than younger drinkers, gave the top 3 rated Rose a score of 53.79 to 58.77 for Sweetness. The bottom 3 wines received a 41.36/100 low to 48.17/100 on the high end.
Wine Experience
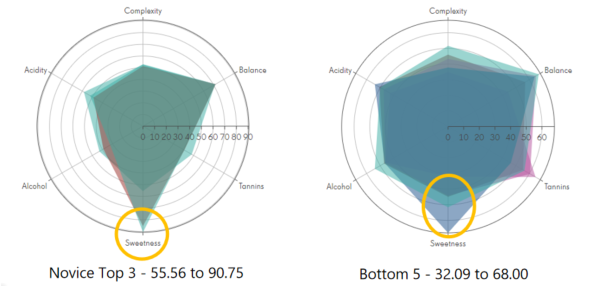
Novice Drinkers:
The top 3 rated wines for self proclaimed ‘Novice’ wine drinkers on Quini scored 55.56/100 to 90.75/100 on the Sweetness scale. The bottom 5 rated wines got a Sweetness impression of 32.09/100 to 68.00/100.
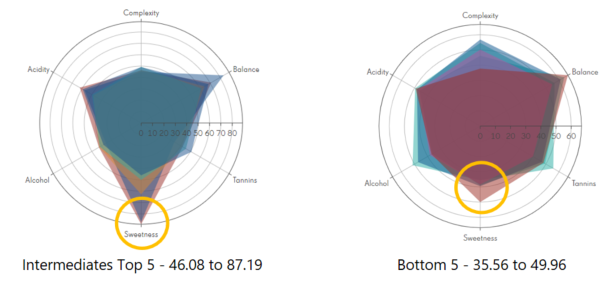
Intermediate Experience Wine Drinkers:
The top 5 rated wines for intermediate wine drinkers on Quini got a Sweetness impression of 46.08/100 to 87.19/100. The bottom 5 rated wines garnered a Sweetness impression of 35.56/100 to 49.96/100.
SUMMARY
The data findings provide strong evidence that sweeter rose wines are preferred by consumers across different age groups and levels of wine experience. From millennials to boomers and gen x consumers, as well as novices to intermediate wine drinkers, the higher rated wines in the majority consistently received relatively higher sweetness impressions. By embracing this consumer-driven trend, winemakers and distributors can tap into new opportunities, enhance customer satisfaction, and shape the future of Rose wines in the market.
METHODOLOGY
Our analysis incorporated 45 Rose wines tasted and rated on Quini using the Quini wine tasting and rating app, from the middle of 2017 to June 2023. The majority of the 2450 reviews were captured during Quini guided consumer tastings held in North America, with most held in British Columbia, Canada. The number of individual consumer reviews for each wine range between 20 at a minimum and up to 145. Within the Quini app, consumers have the ability to indicate their perception of Sweetness of each wine tasted, going from Dry to Semi-Sweet or Sweet, on a hidden 100 point scale. We used the QUINI DATA™ analytics platform to filter and visualize the results.
To take a closer look at the data or for additional information, please contact us at info@quiniwine.com.


Comments